Turn your business to the next level
Transform data into decisions.
AI-powered business intelligence. Connect your data sources, ask questions in plain English, and get dashboards and insights your whole team can use. Meet us at the Hyderabad Entrepreneurship Summit for a quick 5–10 minute live demo.
- Ask a business question and watch the dashboard get built live
- See how Analytify connects Excel, Tally, Shopify, GA4, databases and more
- Explore embedding analytics into your own app or platform
You're booked, thank you!
We've noted your morning preference. You'll get a confirmation email shortly, and we'll confirm your slot before 20 November.
Find us at Booth 10, HICC Novotel.
See how Analytify works
Connect your data, ask a question, and get a dashboard you can share. A quick look before you visit the booth.
Everything you need to run on data
One platform for your data, your dashboards and your questions.
Unified data
Connect multiple data sources in one place.Databases, spreadsheets, CRMs and business apps through 750+ connectors, joined across sources.
AI-powered insights
Get meaningful answers with Genie AI.Ask in plain English and get the answer, the chart and the reason behind it.
Smarter decisions
Discover trends and opportunities through interactive dashboards.Drill down from a headline number to the exact rows behind it.
Real-time analytics
Monitor business performance with clarity.Dashboards stay in sync with your sources, so everyone sees the latest numbers.
Business growth
Turn data-driven decisions into measurable results.Track the metrics that matter and act on them sooner.
Embed anywhere
Embed into any application or platform.Put dashboards and analytics inside your own product, portal or website with the embed SDK.
Real dashboards, built in Analytify
Open a live one on your phone right now, or see more at Booth 10.
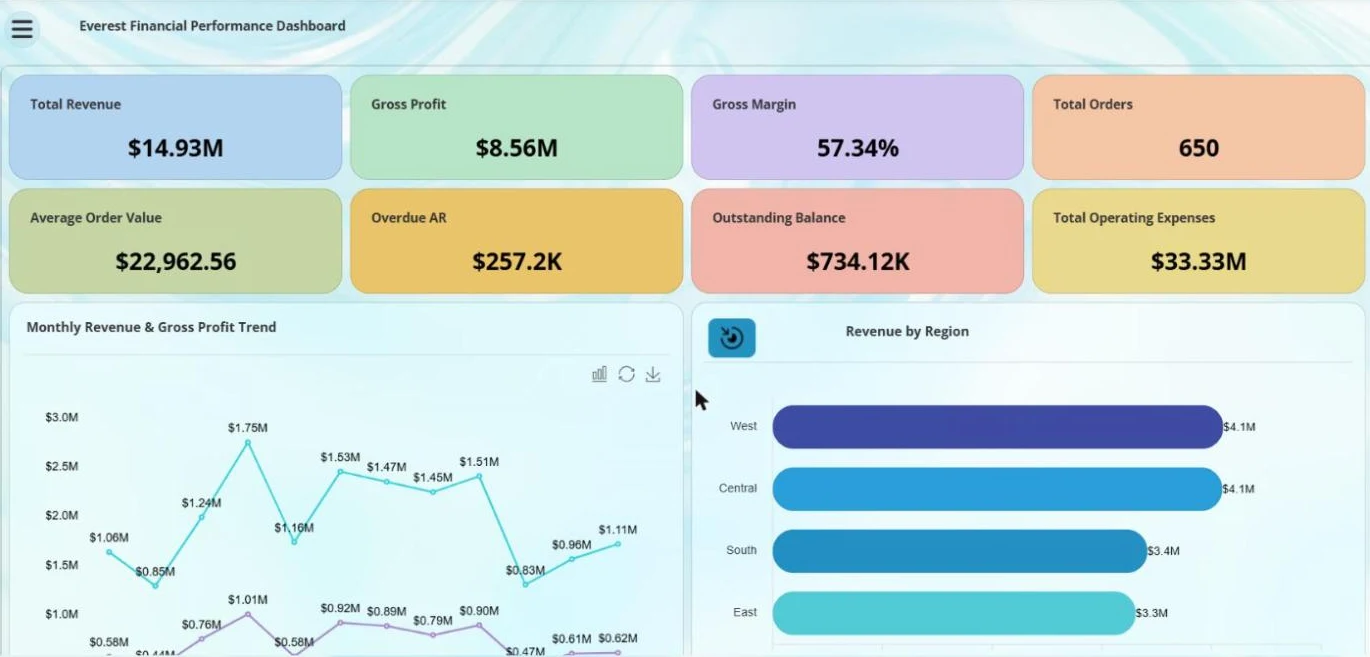 Live
Financial performance
Revenue, gross margin, receivables, top customers, product profitability and pipeline in one live view.
- Which customers are overdue?
- Where is our margin coming from?
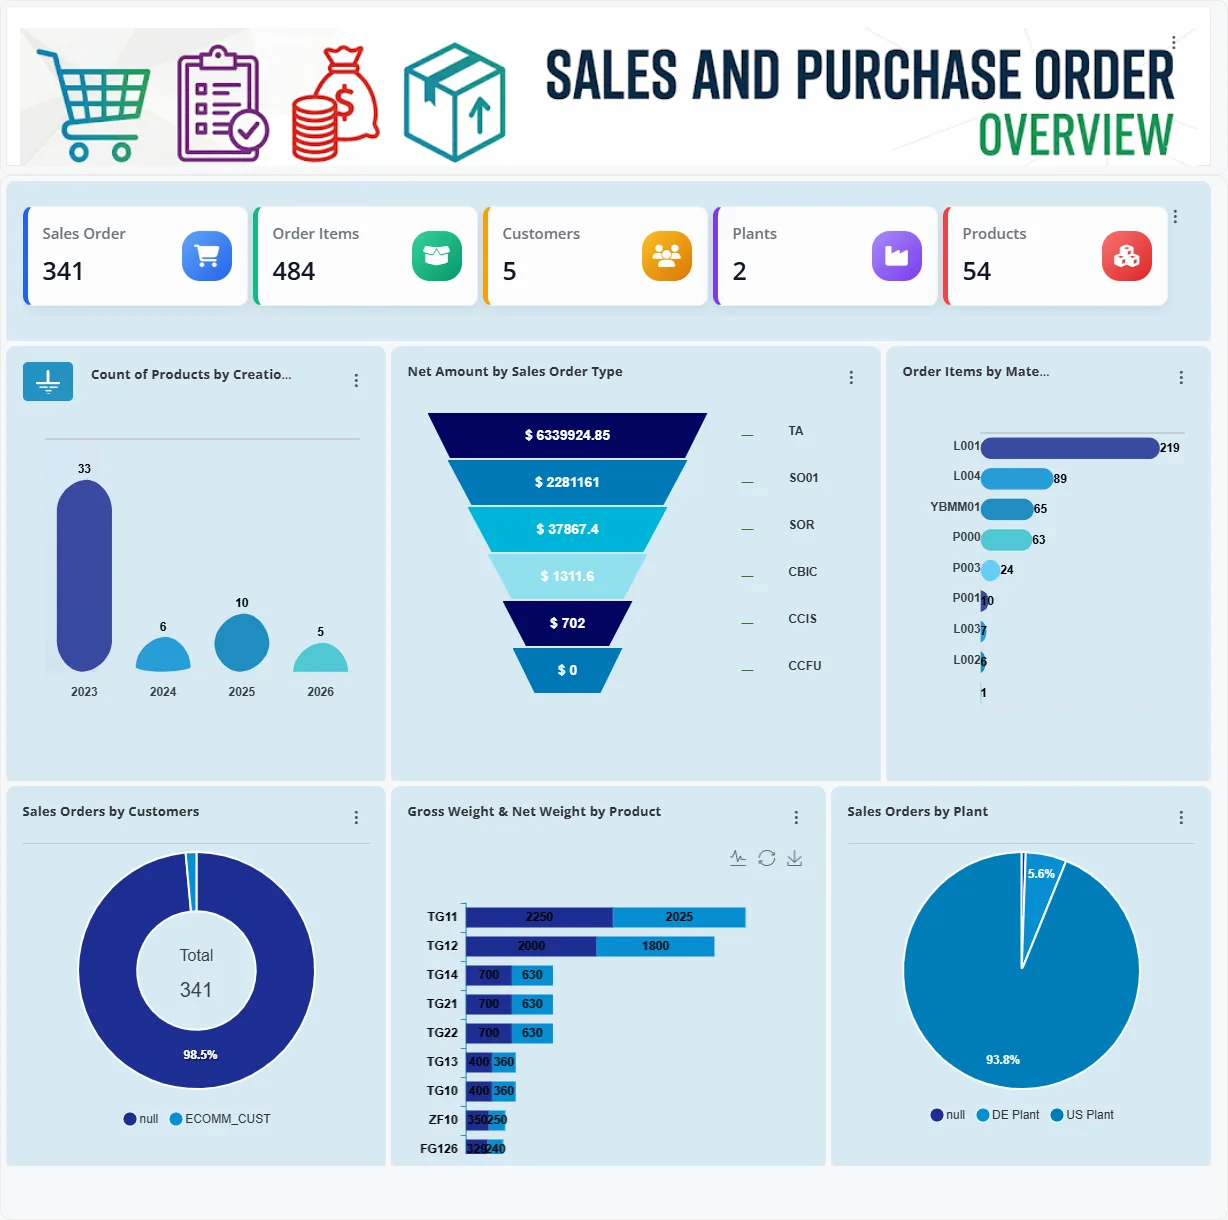
Sales & purchase orders
Sales orders, customers, plants and products together, with funnels and drill-downs to each order.
- Which plant is behind on orders?
- Show order value by type.

Your dashboard, from one prompt
Pick your tables, describe what you need in plain English, and Genie builds the dashboard for you to customise.
- Build a dashboard of our key business metrics.
- Why did sales dip last month?
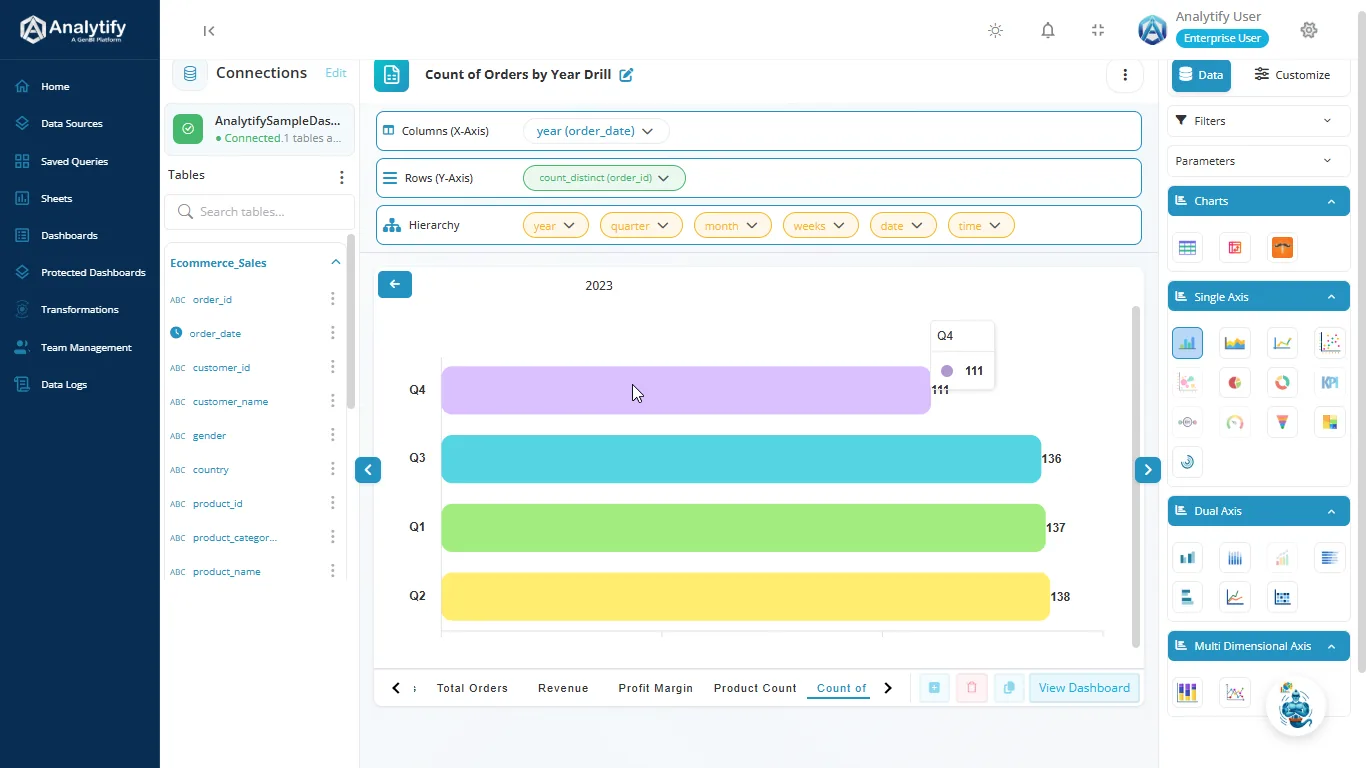
Drag-and-drop reports
Build sheets with drag and drop, choose dimensions and measures, and drill down by year, quarter, month and day.
- Orders by year, then by quarter.
- Join two sources in one sheet.
Dashboards shown with sample business data.
We'll build your first dashboard for you, free.
Tell us what you want to track. After the summit, our team builds your first dashboard with you, so you can start using it right away.