Why Traditional BI Is No Longer Enough: The 2026 Case for Governed GenBI
Most organizations do not have a data shortage. They have a decision-making problem.
Customer information lives in CRM platforms. Revenue and cost data sits in ERP and finance systems. Product behavior is captured in application telemetry. Marketing performance is spread across advertising, automation, and web analytics tools. Support signals sit in ticketing systems, while operations teams rely on spreadsheets, internal databases, and workflow platforms.
Leaders are surrounded by dashboards, reports, KPIs, and data exports, yet they still struggle to answer basic questions quickly:
- Why did revenue fall in a specific region or customer segment?
- Which customers are most likely to churn this quarter?
- Which marketing channels create profitable customers, not just leads?
- Which operational bottlenecks are affecting customer experience or margin?
- What changed, why did it change, and what should the team do next?
This is the gap between business intelligence and business decision-making.
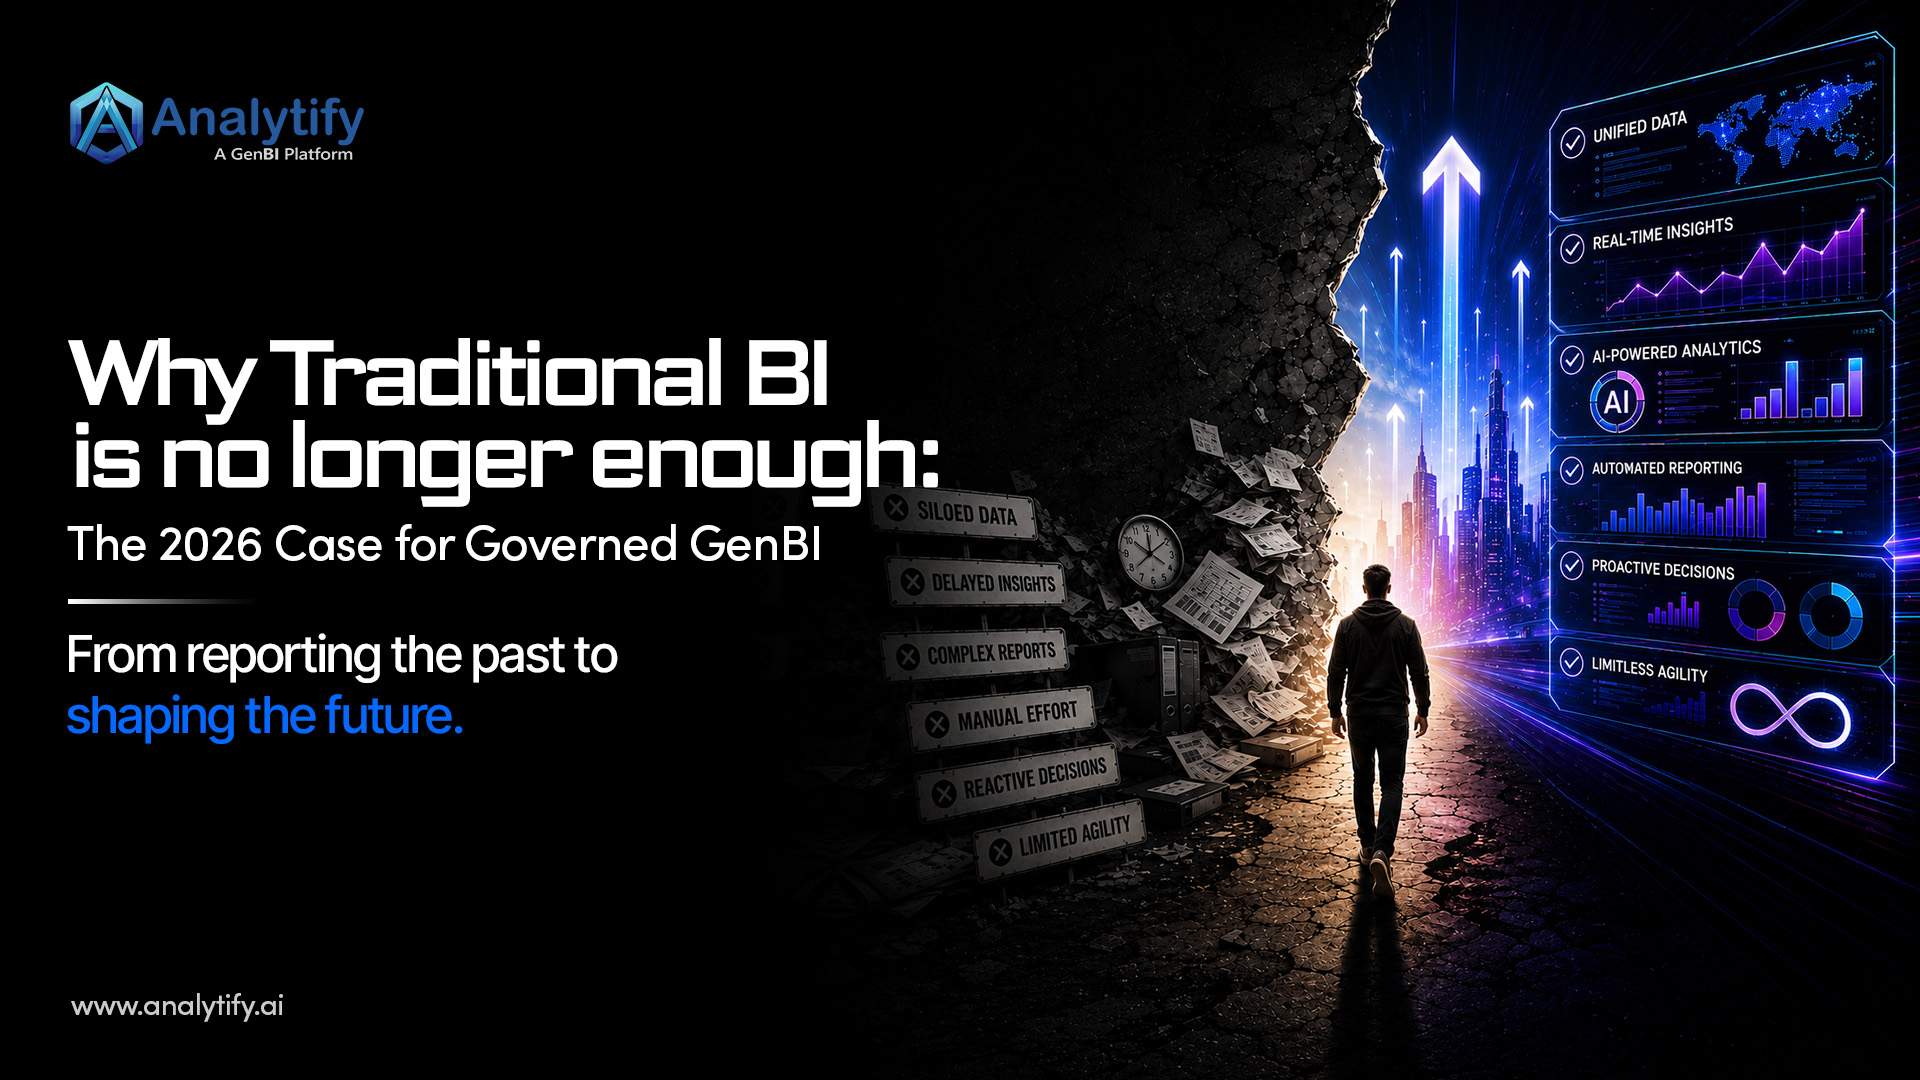
Traditional BI made reporting more visual and accessible. But in 2026, static dashboards alone are not enough. Leaders need trusted, connected, AI-powered intelligence that helps them explore business questions, identify drivers, anticipate risks, and take action with confidence.
That is why more organizations are moving toward Generative Business Intelligence (GenBI).
The reporting challenge leaders face
The modern enterprise creates data in every function, but the data is rarely unified, consistently defined, or easy for business teams to use.
A sales leader may look at pipeline in the CRM. A marketing leader may report on campaign performance from an advertising platform. Finance may use a separate revenue model. Customer success may track health scores in another tool. Product teams may rely on usage analytics somewhere else.
Each report may be technically correct. But when those reports use different definitions, different refresh schedules, or incomplete data, leadership teams lose time reconciling numbers before they can make a decision.
The problem is not simply access to data. It is a lack of decision-ready data.
In Informatica’s 2026 survey of 600 data leaders, 57% said data reliability was a top barrier to scaling AI. The same research found that 76% of organizations said their governance practices were not fully keeping pace with employee AI use.
This creates a serious leadership issue. If the underlying data is inconsistent, incomplete, or poorly governed, a dashboard can mislead decision-makers—and an AI assistant can generate faster but equally unreliable answers.
Why traditional BI is falling short
Traditional BI tools remain useful for scheduled reports, KPI monitoring, and visualization. The issue is that most were designed for a different decision-making environment.
They were built around dashboards, predefined queries, analyst-created reports, and periodic refresh cycles. Leaders today need to make decisions across constantly changing customer, market, operational, and financial conditions.
Traditional BI often struggles with five major limitations.
1. It is mostly retrospective
Dashboards are good at showing what happened last week, last month, or last quarter. They are less effective at explaining why performance changed or what is likely to happen next.
For example, a revenue dashboard may show that sales declined by 12%. But leaders still need answers to more important questions:
- Did revenue decline because of fewer leads, lower conversion, discounting, delayed renewals, product issues, or inventory constraints?
- Which customers, products, channels, or regions are responsible?
- Is this a temporary fluctuation or an emerging risk?
- What action should the team take this week?
Traditional reporting often requires analysts to build additional reports or manually investigate the answer. By the time the analysis is complete, the business opportunity may have changed.
2. It depends too heavily on data teams
Business users often need to submit requests to analysts or BI teams for every new question, metric, filter, report variation, or data source.
This creates a familiar cycle:
- A leader sees an issue in a dashboard.
- They ask for more detail.
- The analytics team builds a new report or query.
- The leader asks a follow-up question.
- The process repeats.
This is not a failure of the data team. It is a limitation of the traditional BI workflow.
When business users cannot safely explore information on their own, decision-making becomes slower and analysts spend too much time answering repetitive reporting requests instead of performing high-value analysis.
3. It does not solve fragmented data
Most business decisions require context from more than one system.
A customer churn decision may require product usage, support tickets, billing history, renewal dates, NPS feedback, account-manager notes, and engagement data. A marketing investment decision may require advertising spend, campaign activity, sales pipeline, customer acquisition cost, conversion rate, and customer lifetime value.
Yet many dashboards still reflect one department or one data source at a time.
Cloudera’s 2026 research highlights the scale of this issue: 56% of respondents identified siloed data and difficulty integrating sources as a barrier to preparing data for AI. The same survey found that 73% said their organizations should prioritize AI data quality more than they currently do.
When data remains fragmented, decisions become fragmented too.
4. It does not create a shared definition of business performance
Different teams often use the same words to mean different things.
What counts as an active customer? When does a lead become qualified? How is churn calculated? Which revenue figure should finance, sales, and customer success use? Which date defines conversion? How should discounts, refunds, renewals, and expansions be treated?
Without governed metric definitions, companies end up with multiple versions of the truth.
This problem becomes more serious when AI is introduced. An AI assistant can generate a polished answer in seconds, but the answer is only useful if the underlying definitions, data sources, permissions, and business context are trustworthy.
See the difference in practice: Analytify AI unifies fragmented data and answers business questions in plain English, on governed metrics your teams can trust. Book a quick demo →
The AI reality: adoption is growing, but trust is lagging
Organizations are investing heavily in AI because they want faster decisions, greater productivity, improved customer experiences, and better business outcomes.
The early results are encouraging—but uneven.
Deloitte’s 2026 enterprise AI research found that 66% of organizations reported productivity or efficiency gains from AI, while 53% reported improved insights and decision-making. However, only 20% reported revenue growth from AI initiatives.
McKinsey’s 2026 global AI survey reached a similar conclusion. While AI adoption is expanding, only 37% of respondents reported a positive contribution from AI to organizational EBIT. McKinsey also found that only 6% of organizations qualified as AI high performers, companies that attributed at least 5% of EBIT to AI and reported significant AI impact.
The lesson is clear: AI does not automatically produce business value.
Companies see measurable results when they connect AI to trusted data, well-defined business metrics, real workflows, and decisions that have a direct impact on revenue, cost, customer retention, risk, or operational performance.
Industry leaders are facing the same challenge in different forms
The need for better reporting and decision-making affects every industry. The data sources, risks, and outcomes may differ, but the core challenge is the same: leaders need timely, trusted answers from complex and fragmented data.
Financial services: speed must not compromise control
Banks, insurers, fintech companies, and financial institutions need to make decisions across customer activity, fraud, credit risk, compliance, lending, profitability, and operations.
However, data often remains distributed across legacy core systems, digital channels, risk platforms, customer databases, and regulatory reporting environments.
A 2026 report from the Cambridge Centre for Alternative Finance found that data availability and quality were the leading constraint on AI adoption in financial services. The issue was cited by 66% of AI vendors, 46% of regulators, and 40% of industry respondents.
For financial-services leaders, the challenge is not only to make faster decisions. It is to ensure those decisions are explainable, auditable, secure, and compliant.
GenBI can help by providing governed, permission-aware access to customer, risk, and operational data, while preserving data lineage, metric definitions, and oversight.
Healthcare: better insights require better data confidence
Healthcare organizations need to connect clinical, patient, claims, workforce, scheduling, financial, and operational data. Yet these data sources are frequently separated across systems and care settings.
This affects decisions about patient access, staffing, capacity planning, treatment operations, reimbursement, resource allocation, and care coordination.
Riverbed’s 2026 healthcare research found that only 49% of decision-makers were fully confident in the accuracy of their organization’s data for generating accurate AI outcomes. The study also found that 60% of healthcare AI projects remained in pilot stages, while 88% agreed that improving data quality is critical to AI success.
For healthcare leaders, GenBI cannot simply be a conversational interface. It must be secure, governed, role-aware, and built on data that clinicians and operational teams can trust.
Retail and e-commerce: customer, campaign, inventory, and margin data are disconnected
Retailers and e-commerce businesses have more customer and transaction data than ever before. But it is often separated across commerce platforms, marketplaces, point-of-sale systems, loyalty programs, customer-support tools, marketing platforms, inventory systems, and supply-chain applications.
As a result, leaders struggle to connect critical business questions:
- Which campaigns create profitable customers?
- Which products are increasing revenue but reducing margin?
- Which customer segments are at risk of not returning?
- Which stockouts are causing lost sales?
- Which promotions drive incremental demand rather than discounting purchases that would have happened anyway?
Traditional reporting may show campaign performance, sales performance, inventory performance, and customer performance separately. GenBI makes it possible to examine these signals together.
SaaS and technology: product data is disconnected from revenue data
SaaS companies need to understand the full customer journey: acquisition, activation, feature adoption, engagement, renewal, expansion, and churn.
But product telemetry, CRM data, billing data, support interactions, marketing activity, and customer-success notes are often disconnected.
This makes it difficult for leaders to identify which product behaviors correlate with higher retention, which accounts are likely to churn, which customers are ready to upgrade, or which onboarding gaps are affecting conversion.
McKinsey’s 2026 research found that reported AI-driven revenue gains are most common in marketing and sales, followed by product and service development.
For SaaS businesses, this creates a clear GenBI opportunity: connect product, customer, and commercial data so teams can make faster decisions about conversion, expansion, customer health, and retention.
Manufacturing and operations: decisions are still too reactive
Manufacturers and operations teams manage data across ERP systems, production environments, warehouses, procurement tools, logistics platforms, quality systems, maintenance applications, and supplier networks.
The problem is not a lack of operational data. It is the inability to connect operational signals to financial and customer outcomes quickly enough.
Leaders need to know:
- Which production delays are likely to affect customer commitments?
- Which supplier issues are creating margin pressure?
- Which quality problems are increasing returns or service costs?
- Which inventory risks could create stockouts or lost revenue?
- Which operational bottlenecks are reducing throughput?
Traditional BI can document these problems after they occur. GenBI helps teams identify patterns, investigate exceptions, and understand likely impact earlier.
What GenBI changes
Generative Business Intelligence is not just a chatbot placed on top of dashboards.
A strong GenBI platform, such as Analytify AI combines connected data, business context, governed metrics, natural-language interaction, AI-assisted analysis, and actionable workflows.
It helps users move beyond asking, “What does this dashboard say?” to asking, “What changed, why did it change, and what should we do next?”
A mature GenBI approach should deliver four core capabilities.
Connected business data
GenBI should bring together the data needed for a real decision, not just data from one department or one application.
For example, a revenue-risk question may need CRM pipeline, billing, renewal dates, product usage, support data, and customer-success activity. A GenBI platform should make these sources available within a governed environment rather than forcing teams to reconcile multiple reports manually.
A governed semantic layer
Every organization needs shared definitions for critical metrics such as revenue, gross margin, customer lifetime value, active user, churn, pipeline, retention, utilization, inventory turnover, and conversion rate.
A governed semantic layer ensures that teams and AI systems use the same business definitions. It reduces metric disputes, improves trust, and allows users to ask questions in natural language without accidentally querying the wrong data or interpreting a metric incorrectly.
Natural-language exploration
Business leaders should not need to know SQL, data-model structures, dashboard filters, or report names to ask an important question.
With GenBI, they should be able to ask:
- Why did enterprise pipeline decline this month?
- Which accounts have declining product usage and renew in the next 90 days?
- Which campaigns generated the highest-value customers in the last quarter?
- Which regions have the largest margin decline, and what are the drivers?
- What operational delays are most likely to affect this month’s revenue target?
The platform should respond with a clear answer, supporting metrics, breakdowns, relevant visualizations, and traceability back to trusted sources.
Actionable and traceable intelligence
The ultimate value of GenBI is not better answers alone. It is better action.
A GenBI platform should help teams detect anomalies, forecast outcomes, identify drivers, prioritize opportunities, and connect insights to workflows.
For example:
A customer-success leader receives an alert that a high-value account has declining usage, unresolved support tickets, and an upcoming renewal. The team can investigate the account, understand the evidence, assign an intervention, and track the outcome.
That is more valuable than discovering the same risk in a monthly dashboard after the customer has already decided not to renew.
Why governance is essential to GenBI
The need for governance becomes even more important as organizations give more employees access to AI-enabled analytics.
Grant Thornton’s 2026 AI Impact Survey found that 78% of business executives did not have strong confidence that they could pass an independent audit of their AI governance within 90 days.
This should be a warning against treating GenBI as a generic AI interface connected to enterprise data.
A trustworthy GenBI strategy requires:
- Role-based access controls.
- Clear ownership of key metrics.
- Data lineage and source visibility.
- Approved semantic definitions.
- Audit trails for AI-assisted analysis.
- Secure handling of sensitive data.
- Human review for high-impact decisions.
- Monitoring for inaccurate, incomplete, or misleading outputs.
The goal is not to make every business decision autonomous. The goal is to help people make better decisions faster, with the right context, the right controls, and the ability to verify the answer.
The move from reporting to decision intelligence
The transition from traditional BI to GenBI is not about eliminating dashboards. Dashboards will continue to be useful for monitoring KPIs, executive reviews, operational reporting, and recurring analysis.
But dashboards alone cannot meet the needs of leaders who need to understand changing conditions in real time, ask unplanned questions, connect information across systems, and act before a risk becomes a financial outcome.
The difference is clear:
| Traditional BI | Governed GenBI |
|---|---|
| Shows what happened | Helps explain what changed, why it changed, and what may happen next |
| Relies on predefined reports and dashboards | Enables natural-language questions and follow-up exploration |
| Requires frequent analyst support | Gives business users governed self-service access |
| Uses data that may vary across reports | Applies shared definitions through a semantic layer |
| Focuses on visualization | Combines answers, explanations, forecasting, and recommendations |
| Delivers insights after the fact | Surfaces risks, anomalies, and opportunities proactively |
| Treats governance and AI separately | Builds permissions, lineage, controls, and auditability into the decision process |
| Stops at reporting | Connects intelligence to workflows and business action |
The next stage of business intelligence
The companies that benefit most from AI will not necessarily be the companies with the most dashboards, the largest data warehouse, or the most AI pilots.
They will be the companies that can turn trusted data into timely decisions.
In 2026, leaders need more than reports. They need a clear view of what is happening across the business, the ability to understand why performance is changing, and the confidence to act on that information.
That is the promise of GenBI.
It does not replace business judgment. It gives business judgment better evidence.
It does not eliminate analysts. It enables analysts to focus on strategic analysis instead of repetitive reporting requests.
It does not make every decision automatic. It makes every decision more informed, more timely, and more traceable.
For organizations still relying on fragmented reports and static dashboards, the question is no longer whether they need AI. The real question is whether their data, governance, and reporting environment are ready to support smarter decisions.
How Analytify AI helps teams move to GenBI
Moving from traditional BI to Generative Business Intelligence requires more than adding an AI assistant to existing dashboards. Organizations need connected data, consistent business definitions, governance, natural-language exploration, and a practical way to turn insights into action.
Analytify AI helps teams build that foundation. It brings together data from business systems, databases, cloud applications, and operational tools into a unified analytics environment. Leaders and business users can explore governed data, investigate performance changes, identify drivers, and uncover opportunities without relying on a new manual report for every question.
With Analytify AI, organizations can:
- Connect fragmented data across sales, marketing, finance, product, operations, customer success, and support.
- Establish trusted, consistent metrics for revenue, pipeline, churn, retention, margin, utilization, and other core KPIs.
- Enable natural-language analysis for faster exploration and follow-up questions.
- Detect anomalies, forecast outcomes, and investigate the drivers behind business changes.
- Deliver embedded analytics and AI-powered insights within internal applications or customer-facing products.
- Maintain appropriate permissions, governance, and traceability as AI-powered analytics scales.
For example, instead of waiting for a monthly churn dashboard, a customer-success leader can investigate which accounts have falling product usage, unresolved support issues, upcoming renewals, and the greatest potential revenue risk.
Analytify AI helps teams turn fragmented data into trusted, actionable intelligence, so they can make faster, more informed business decisions.
Explore Analytify AITalk to our team
The next era of BI is not more reporting. It is governed, AI-powered decision intelligence built on data leaders can trust.