By Raja Shekar, Senior Engineering Lead @AnalytifyAI
In the world of data exploration, more isn’t always better. When you’re staring at a dashboard with dozens of filter options, finding the exact slice of data you need can feel like searching for a needle in a haystack.
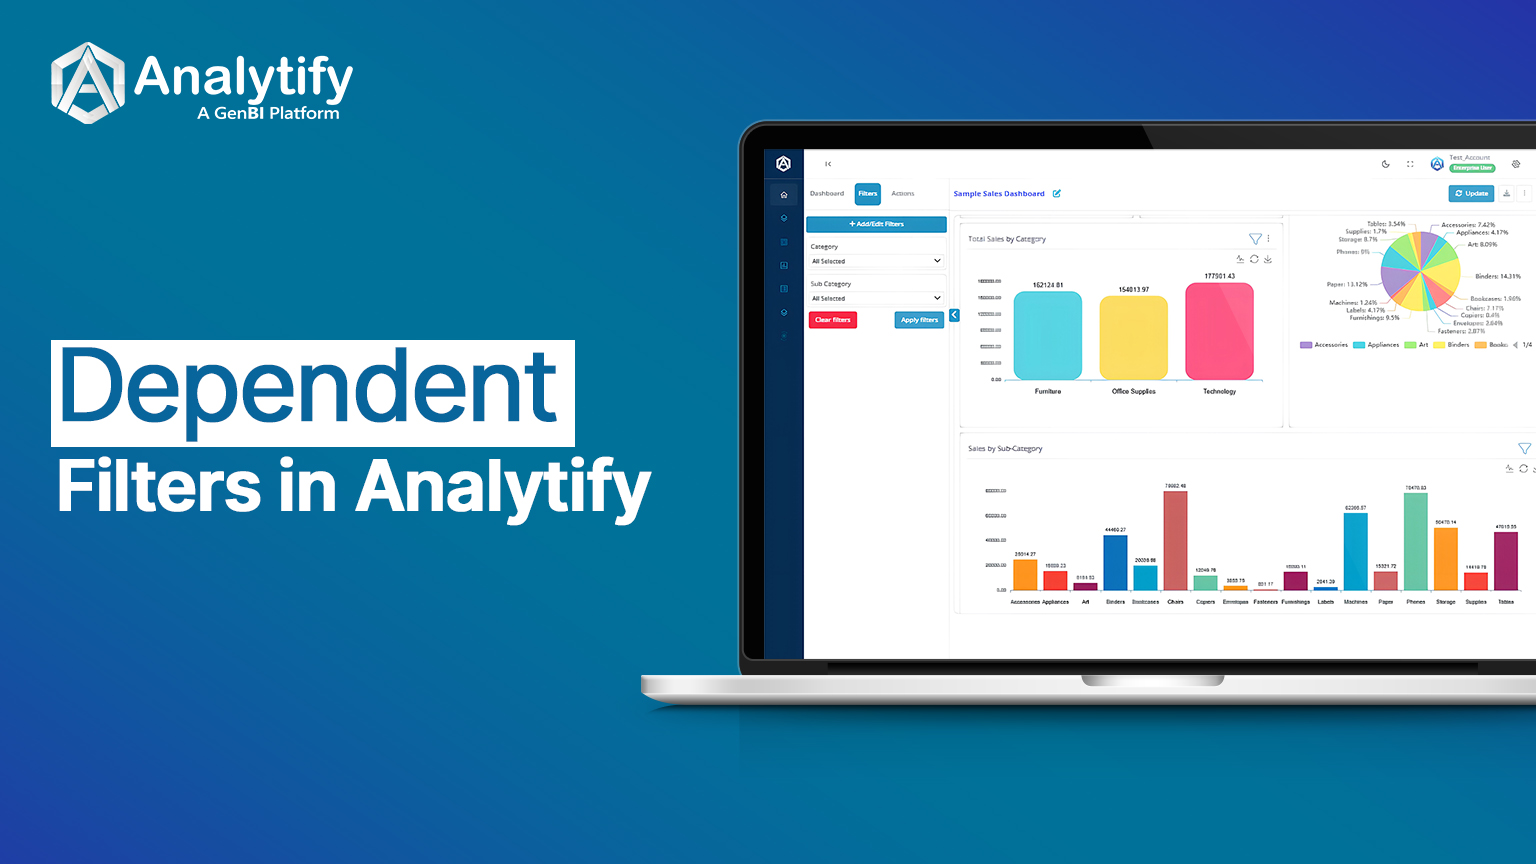
At Analytify, we believe your dashboard should think with you. That’s why we’ve introduced Dependent Filters (also known as cascading filters)—a feature designed to make your data exploration dynamic, context-aware, and incredibly efficient.
What Are Dependent Filters?
Standard filters operate in silos; what you select in one rarely affects the options in another. Dependent Filters break those silos. They create a hierarchical relationship where the selection in a “Parent” filter automatically narrows down the available choices in a “Child” filter.
Simply, instead of showing every possible option at once, the dashboard intelligently narrows down choices so users only see what’s relevant to their current context. This creates a smoother, more guided analytics experience.
Let’s Imagine selecting “Furniture” in a Category filter. Instead of scrolling through an endless list of every product your company sells, the Sub-Category filter instantly updates to show only items relevant like Chairs, Tables, and Bookcases.
Key Characteristics of Analytify’s Filter Logic
What makes this feature a must-try for any data enthusiast?
● Context-Awareness: The dashboard “understands” the relationship between your data dimensions.
● Dynamic UI: Dropdown menus update in real-time without refreshing the entire page.
● Data Integrity: It prevents “Empty State” errors by ensuring users can only select combinations that actually contain data.
● Simplified UX: It reduces cognitive load by hiding irrelevant information, guiding the user through a logical flow.
How Dependent Filters Work in Analytify?
Step 1: Create Your Parent Filter (The Category Filter)
Start by accessing your dashboard in Analytify. For this example, we’re using sample sales data.
Create the first filter:
1. Add a new filter component
2. Select your database connection
3. Choose your query set (e.g., “Sales Analysis”)
4. Select the column: Category
5. Configure display settings and save
Important: This first filter acts as the parent filter. At this stage, it doesn’t have any dependency configuration—it’s just a standard filter.

Step 2: Create Your Dependent Filter (The SubCategory Filter)
Now create the second filter that will depend on the first:
1. Add another filter component
2. Select the same database and query set
3. Choose the column: SubCategory
Here’s where the magic happens: Analytify automatically detects that SubCategory could logically depend on Category. The system enables the dependency option, allowing you to choose the existing category filter as the parent.

4. Toggle the dependency option ON
5. Select “Category” as the parent filter
6. Save
That’s it — no complex setup, no extra steps.
Step 3: See It in Action
Once configured, the dashboard becomes instantly more intelligent.
● Selecting Furniture in the Category filter limits the Sub Category options to only furniture-related values.
● Switching the Category to Technology automatically updates the Sub Category filter to show only technology-specific values.

When filters are applied, the dashboard updates seamlessly to reflect accurate, relevant data.
Want to see this in action? Here’s the complete workflow:
Real-World Use Cases
Dependent filters are versatile across every industry. Here are a few ways you can implement them today:
● Global Sales: Set Region as the parent and Country as the dependent filter. Selecting “Asia” will instantly limit your country list to that specific region.
● Human Resources: Use Department as the parent and Job Title as the dependent. Selecting “Engineering” ensures you only see roles like “DevOps” or “Software Architect” rather than “Accountant.”
● Inventory Management: Map Warehouse Location to Aisle Number to quickly pinpoint stock without browsing the entire facility’s data.
Technical Benefits: Why Your Data Team Will Love This
1. No Data Model Compromises
Analytify dependent filters work within standard data model design. Your dimension tables stay clean. Your fact tables stay normalized. Relationships can remain as designed.
This matters because:
● Query performance characteristics remain predictable
● Future schema changes are less likely to create cascading issues
● Data lineage remains clear and traceable
● Your data warehouse team stays happy
2. Server-Side Query Optimization
Traditional cascading filters often execute in the client (browser), downloading all values and filtering them with JavaScript. Analytify executes filters server-side, where databases excel at this type of operation.
The architectural difference: We construct precise SQL queries with WHERE clauses rather than filtering large result sets client-side. This approach:
● Reduces network data transfer significantly
● Leverages database query optimization
● Scales more predictably as data volume grows
● Provides more consistent response times
Important note: Real-world performance varies based on many factors including data model design, indexing strategy, network conditions, and query complexity. The key advantage is architectural—server-side query construction provides more predictable scaling characteristics.
3. Predictable Behavior Across Datasets
One of the most frustrating aspects is inconsistent filter behavior. The same configuration workson Dataset A but breaks on Dataset B.
Analytify’s approach:
● Same configuration produces consistent behavior
● Explicit dependency declaration (no implicit guessing)
● Clear validation messages when configuration doesn’t make sense
● Errors surface at creation time, not runtime
4. Developer-Friendly Debugging
When something doesn’t work as expected, the dependency graph is visible in the UI. You can see exactly which filter depends on which, trace the data flow, and identify configuration issues immediately.
Why You Should Try It Today
The goal of a GenBI platform is to bridge the gap between complex data and human decision-making. Dependent filters are more than just a UI enhancement; they are a navigation tool. They ensure your dashboards remain accurate, responsive, and easy to analyze, even when working with massive, multi-layered datasets.
By guiding users through a clear filtering flow, you reduce confusion and prevent incorrect selections, allowing your team to spend less time “fighting” the dashboard and more time uncovering insights.
Ready to build smarter dashboards?
Experience the seamless flow of dependent filters for yourself. Visit analytify.ai to book a personalized demo or start your journey with a free trial.
Common Questions
Q: How many filter levels can I create?
Q: What happens if there are no child values for a parent selection?
Q: Can I have multiple dependent filter groups on one dashboard?
Q: Do dependent filters work with real-time data?
Q: Can users share dashboards with specific filter selections?
Q: Does this work with large datasets (millions of rows)?
Q: Can I control this programmatically via API?
Q: What if my users need to select multiple categories?
No more scrolling through irrelevant options. No more accidentally selecting incompatible filters.
No more “broken dashboard” support tickets.
Just smart, intuitive filtering that makes data analysis feel effortless.
Questions about dependent filters? Drop a comment below or reach out to me directly. I’d love to hear how you’re using this feature in your dashboards.
— Raja Shekar, Senior Engineering Lead, AnalytifyAI
See Analytify embedded inside a live SaaS product.
Get a 30-minute walkthrough. Open-source, multi-tenant, enterprise-ready.